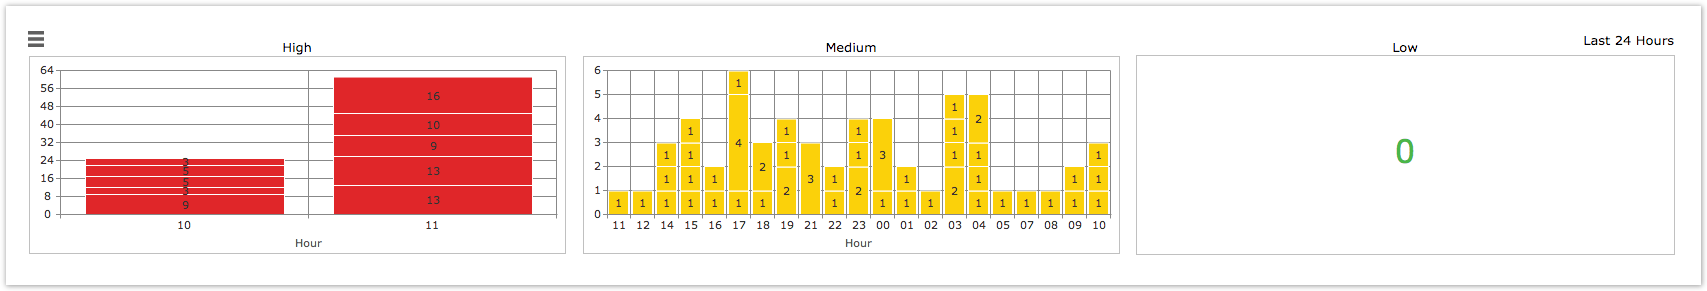
On the Observer Monitor page, you can view hour-by-hour statistics about all of the alerts posted for your ServiceNow instance. At the top of the page, the total numbers of high, medium, and low alerts per hour are shown as bar graphs. If no alert statistics are available for the time window selected, a 0 will appear in place of a bar graph. The trend group charts for these three alert categories are displayed under Alert Trends. Click ![]() to collapse the Alert Trends view.
to collapse the Alert Trends view.
Select a date for alert statistics
When landing on the Monitor page, alerts are displayed for today's date by default. To choose a different date to display alert statistics for, follow these steps:
1. In the upper left-hand corner of the page, click ![]() >
> ![]() .
.
2. Choose the date you want alert statistics to be displayed for and click OK.
Revert alert configuration settings to default values
![]() WARNING! This action cannot be undone.
WARNING! This action cannot be undone.
If you have made changes to the alert configurations and you want to revert all settings back to their default values, click ![]() >
> ![]() in the upper left-hand corner of the page. NOTE: Reverting alert settings back to their default values will delete any custom alerts you have created.
in the upper left-hand corner of the page. NOTE: Reverting alert settings back to their default values will delete any custom alerts you have created.
Next steps
View alert statistics raw data