On the Alert Configurations tab of the Observer Settings page, you can adjust the Triggering Threshold, Velocity, and Analysis Window for each alert category. The alert categories and alert configuration options are described below:
| Alert Category | Description |
|---|---|
| High Alert | A high-priority alert on your ServiceNow data |
| Medium Alert | A medium-priority alert on your ServiceNow data |
| Low Alert | A low-priority alert on your ServiceNow data |
| Configuration Option | Description |
|---|---|
| Triggering Threshold | Indicates a limit which, if reached, will trigger alert flags to be posted to trend groups and alert notifications to be emailed to the addresses specified on the Notifications tab, typically expressed as number of SQL statements executed |
| Velocity | Indicates a speed limit which, if reached, will trigger alert flags to be posted to trend groups and alert notifications to be emailed to the addresses specified on the Notifications tab, typically expressed as number of SQL statements executed per minute/millisecond |
| Analysis Window | Indicates how frequently Observer should post alert flags to trend groups, typically expressed in minutes |
Procedure
To modify your alert configurations, follow these steps:
1. Log into Observer and click ![]() >
> ![]() to navigate to the Settings page.
to navigate to the Settings page.
2. At the top of the page, choose the Alert Configurations tab. Default alerts will be organized into the following groups:
- Database
- Errors
- Hardware
- System Queues
- User Experience
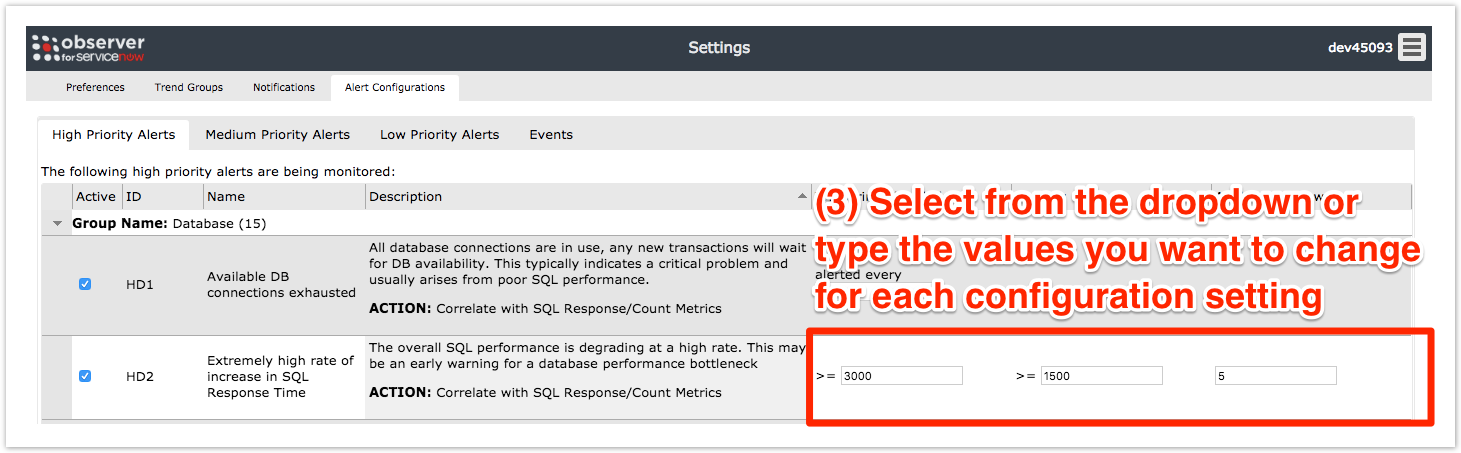
3. Click the ![]() icon to expand the group of default alerts that you want to configure. Then, select or type the values you want to set for each configuration type. For example, for the alert Extremely high rate of increase in SQL Response Time, typing 3000 for Triggering Threshold, 1500 for Velocity, and 5 for Analysis Window will trigger alerts to be posted every 5 minutes if 3000+ SQL statements are executed within 1500 milliseconds.
icon to expand the group of default alerts that you want to configure. Then, select or type the values you want to set for each configuration type. For example, for the alert Extremely high rate of increase in SQL Response Time, typing 3000 for Triggering Threshold, 1500 for Velocity, and 5 for Analysis Window will trigger alerts to be posted every 5 minutes if 3000+ SQL statements are executed within 1500 milliseconds.