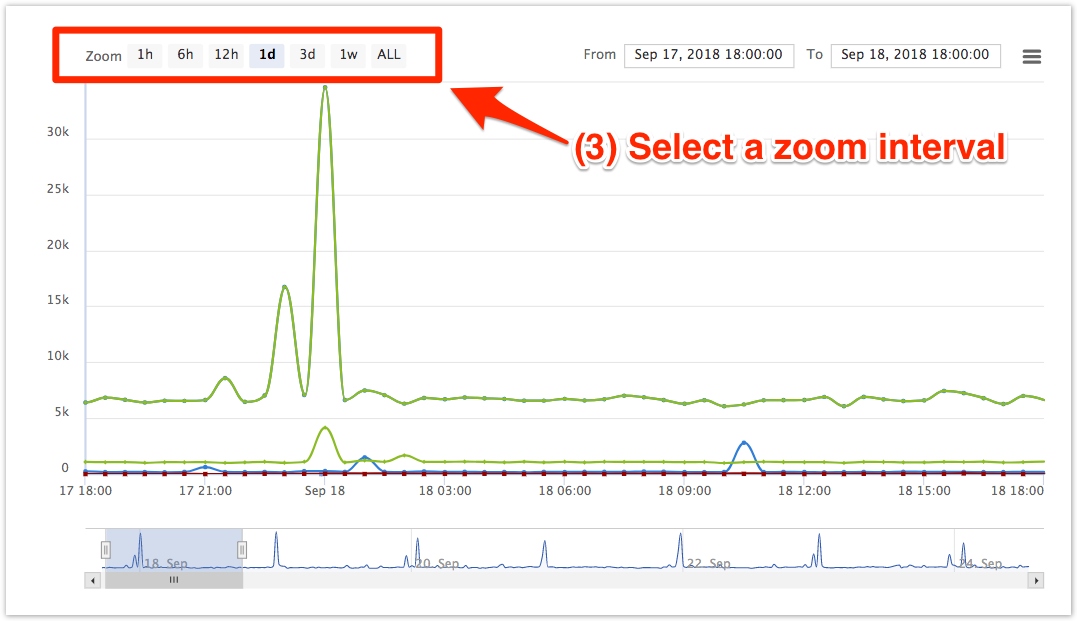
The zoom interval indicates an interval of time for which collected data from ServiceNow is displayed in an Observer trend group chart.
Procedure
To specify a date range for a trend group chart, follow these steps:
1. Log into Observer and click > Problems to navigate to the Problems page.
2. Select the trend group you want to display from the dropdown at the top of the page next to "Raw Data".
3. Scroll toward the bottom of the page to view the trend group chart. At the top left-hand corner of the chart next to Zoom, select the zoom interval you want to display data for. The trend group chart will then be rendered to display data for the zoom interval you have selected. Alternatively, you can manually adjust the zoom interval by clicking and dragging the icons in the highlighted interval underneath the trend group chart. NOTE: To scroll through intervals of data for the date range shown in the trend group chart, click or or click and drag the scroll bar in the highlighted interval underneath the trend group chart.
