You are viewing an old version of this page. View the current version.

Compare with Current View Page History

« Previous Version 17 Next »


This exciting new module provides you with a snapshot of data insights based on your instance. On this page, you'll find everything you need to know about installing the dashboard and what features are included.

Please note that the dashboard is available only with the Perspectium Core Helium update set.

Prerequisites:

Make sure you have the latest Perspectium Core Helium update set installed

Here's what the Dashboard looks like:

Installation

Follow these instructions to install the dashboard feature. If you have completed any of the below steps, simply skip to the next. 

  1. Install the latest Perspectium Core Helium update set (if you haven't already).

  2. Go to the Perspectium > Control and Configuration > Finish Install and click Confirm. This will prevent preview errors when the Perspectium Dashboard update set is committed.

  3. Install the latest Perspectium Dashboard Helium update set. Note: You can also install the Perspectium Dashboard Helium update to an existing instance, but if so, you must run Perspectium Finish Install afterwards.

  4. Fill in Perspectium Properties using Mesh URL pointing to Fluorine 4.6.12 and user with vhost/name
Accessing the Dashboard

To access your dashboard, go to Perspectium Dashboard > Dashboard

In order for the dashboard to display data, you need to first share some data from either bulk or dynamic shares. If your instance does not have any previously-shared data, simply run a few bulk or dynamic shares in order to generate some data to view.

Dashboard Features

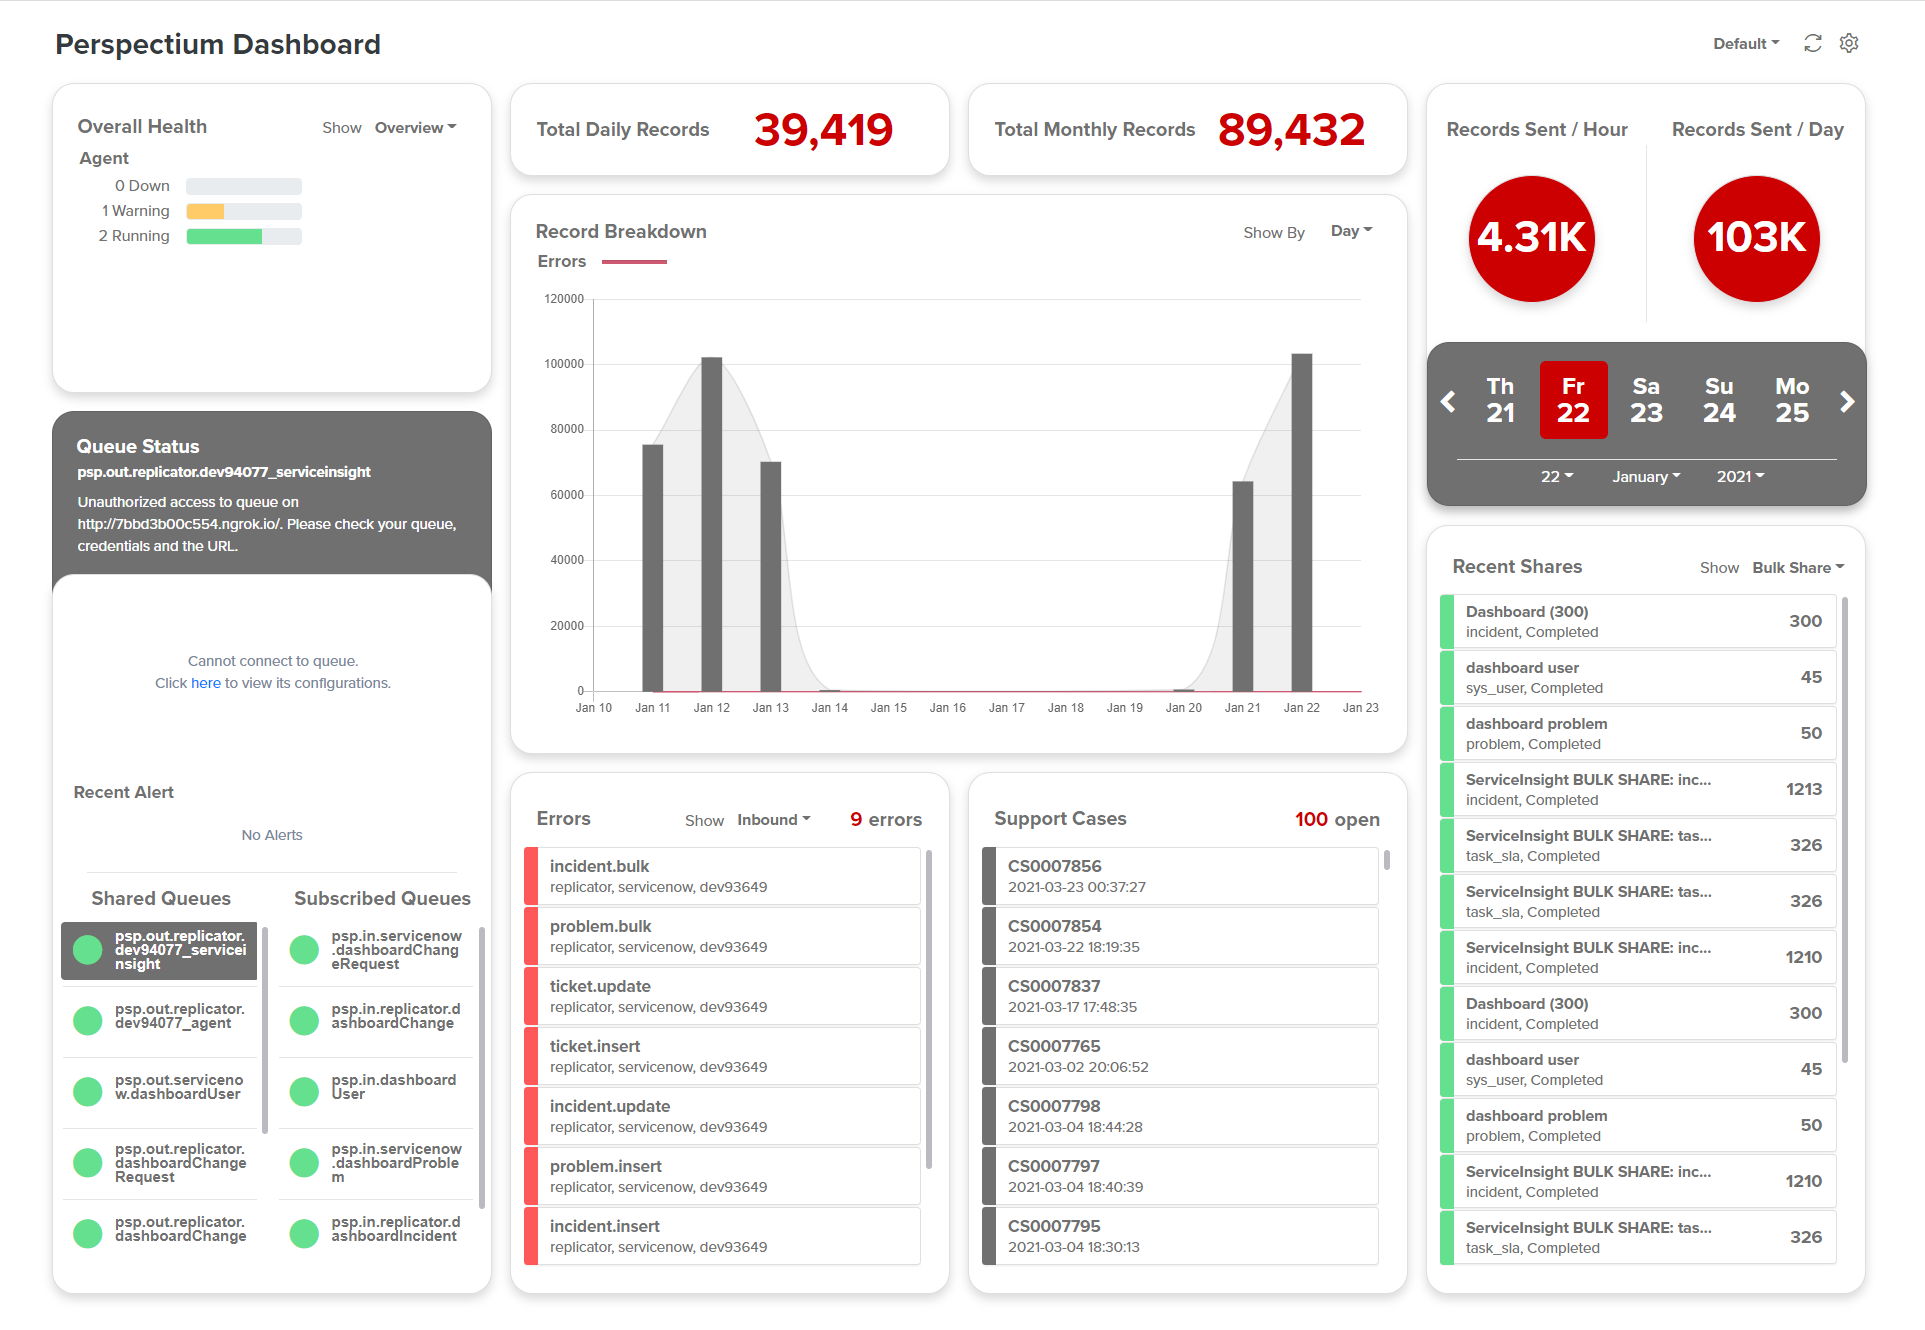
Here's a breakdown of all of the features available on your dashboard. 

Overall Health

Note: This feature is only functional using MBS version 4.6.12. In order to active this feature, follow these instructions:

  1. Download and install any version of DataSync Agent

  2. Use the same Rabbit MBS and credentials between ServiceNow and DataSync Agent

  3. Start/use agent to ensure the heartbeat is sent

Once this is set, the scheduled job will run every 10 minutes and automatically request heartbeats. You can install and run multiple independent agents.

Agent Status Descriptions:

Running: heartbeat is less than or equal to 30 minutes

Warning: heartbeat is greater than 30 minutes but less than 60 minutes

Down: heartbeat is greater than 60 minutes

Queue Status

On first Finish Install, Monitor and Track history will be enabled for all existing queues. This is controlled by a PSP property in the Properties > Dashboard Properties module.

To disable/enable the Monitor and Track history for all queues:

  1. Go to Perspectium > Properties > Dashboard Properties

  2. Uncheck or check the Enable Track History for all queues (necessary for Perspectium Dashboard queue display) property

  3. Click Save

    Note: 
    You may be asked to fill in your Perspectium portal username and password in order to save.

  4. Go to the Shared/Subscribed Queues module and observe how existing queues are updated based on the property value saved

To create a new queue when the Enable Track History property is ON:

  1. Go to the Shared/Subscribed Queues module

  2. Click New

  3. Confirm that Monitor and Track History are enabled on the form

    Note: When Enable Track History is off, the new queue record form does not have Monitor and Track History on automatically

To uncheck Monitor and/or Track History on a queue form when Enable Track History is ON:

  1. Go to the Shared/Subscribed Queues module

  2. Click New or click on an existing queue

  3. Confirm that Monitor and Track History are enabled on the form

  4. Uncheck the Monitor and/or Track History checkboxes

    Note: You should see an info message to let you know that it's important to have these checked, since they are necessary to properly display Queue Status on your dashboard.
Total Daily/Monthly Records

Total Daily Records: Displays the total record shares for the current day. 

Total Monthly Records: Displays the total record shares for the current month. 

Note: Changing the date/month on the calendar does not affect this count.

Average Records Sent + Calendar Select

Use this feature to get a breakdown of the number of records sent based on a selected date in the calendar.

Any time you access or reload the dashboard, the calendar date will reset to the current date.

You can change the date on the calendar using the available arrows or the dropdown settings.

The Records Sent/Day count reflects the number of records sent on the specific calendar date selected.

The Records Sent/Hour count is reflects the number of records sent in the the specific calendar date selected, divided by 24 hours. However, if the current date is selected, then this number is divided by the number of hours that have passed in that day so far. 

Record Breakdown

The Record Breakdown graph is a visualization of data based on the calendar date selected. It reflects both dynamic and bulk shares. Toggle between different data representation (records per hour, day, month, or lifetime).

(info) NOTEShares from additional tables are not counted in the overall share count displayed on the dashboard. This includes additional shares from tables such as sys_attachment, sys_journal, and sys_audit.

Recent Shares

This feature displays the most recent (up to 50) dynamic/bulk shares from you instance. You can click on any entry to access that specific record directly. 

NOTE: Shares from additional tables are not counted in the overall share count displayed on the dashboard. This inlcudes additional shares from tables such as sys_attachmentsys_journal, and sys_audit.

Errors

This feature displays the most recent inbound, outbound, and receipt error messages. Click on any entry to access that message directly.

Support Cases

This feature displays your company's most recent display cases. Access to the Perspectium Portal is required to view support cases directly. If you don't have credentials to your portal, contact Perspectium Support. 

In order to access Perspectium Portal support cases:

  1. Go to Perspectium > Control and Configuration > Properties > Dashboard Settings

  2. Enter your Perspectium Portal username to access the Perspectium Portal

  3. Enter the Perspectium Portal password associated with your username

  4. Click Save

Once this is configured, refresh or revisit your dashboard to view the support cases. You can also access them via Perspectium > Perspectium Core > Dashboard.

General Information

The Perspectium Dashboard Data scheduled job creates the instancedaily payload used to retrieve updated queue and recent shares information. This will run periodically every 5 minutes.