This page covers additional and optional features you can take advantage of is you wish. You are able to customize some of the features and make advanced configurations in Observer for ServiceNow. The topics described in this section are completely optional and may require knowledge of scripting with ServiceNow APIs.
Explore these advanced configurations and customizations:
Custom alerts allow you to define your own alerts to occur when ServiceNow events meet certain conditions. This provides you a way to monitor events that are not covered by the built-in alerts already included with Observer.
Here's how to create one:
- In Observer, click the menu icon (
 ), followed by the Settings icon (
 ), followed by Alert Configurations
 - Near the bottom right corner of the page, above theActions column, click +New
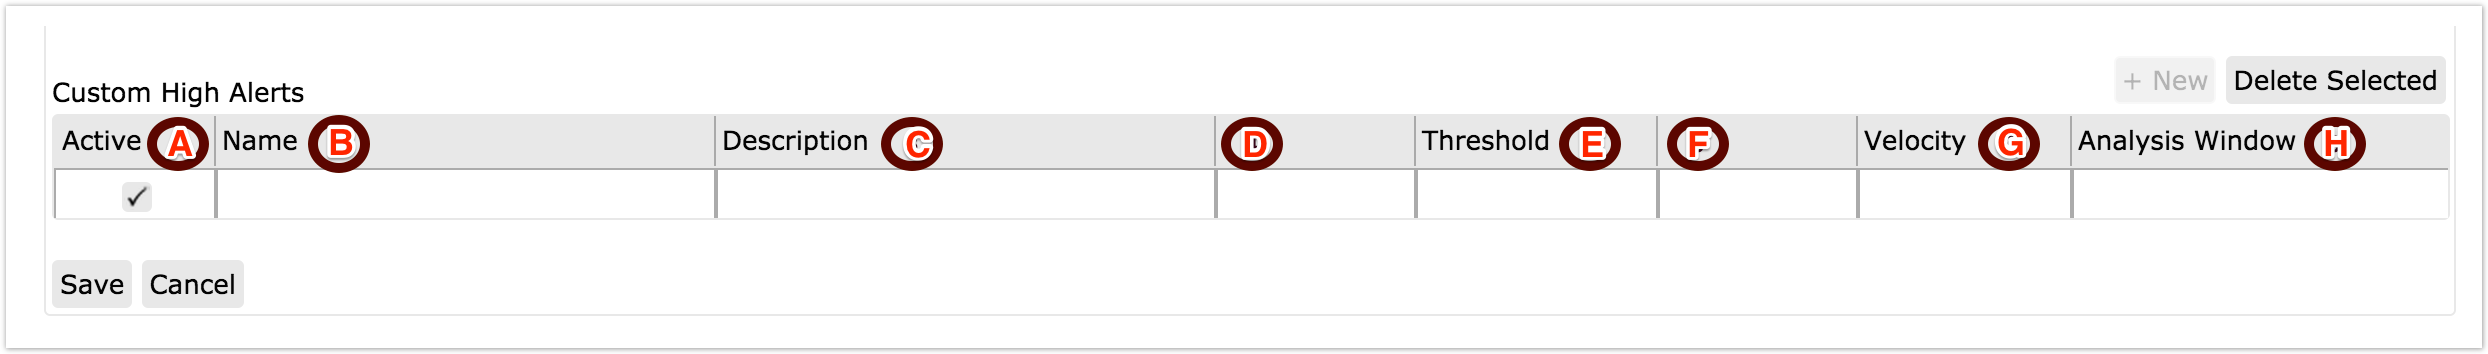
- Type directly in each of the fields to add your custom alert (see more information below). At least one out of three of the following fields must be filled out: Threshold, Velocity, Analysis Window.
- Click Save
Field descriptions:
(A) Active: Check the box to make your custom alert active in Observer.
(B) Name: The name of the custom alert which is also the name of the event that will cause this alert to occur. This is the name that is sent in the “name” field of messages sent from your ServiceNow instance to Observer. For example, if your ServiceNow instance has events called “Perspectium_Monitor” and you've set it up inside the Perspectium app (under Perspectium > Observer > Event Subscription) to send messages to Observer, then you can create a custom alert with this name to alert when certain conditions are met as described below.
(C) Description: Type any description for your custom alert.
(D) Threshold Operator: A dropdown containing operators such as “>”, “<”, “>=”, “==”, etc. This is used with the valued entered for threshold to determine a minimum, maximum or specific event value in order for the alert to occur. For example if you have “>” here and “25” in threshold, the condition for this alert with be an event that has a value of greater than 25.
(E) Threshold: The maximum value that must be met and/or exceeded for this custom alert to be triggered. This value must be a number value and is used in conjunction with the threshold operator value to determine how the threshold behaves.
(F) Velocity Operator: A dropdown containing operators such as “>”, “<”, “>=”, “==”, etc. This is used with the valued entered for velocity to determine the velocity direction. For example if you have “>=” here and “5” in velocity, the condition for this alert with be a velocity of greater than or equal to 5.
(G) Velocity: When an event is received, the rate of change per minute that must be met from the last time this event occurred for this alert to happen. This is used in conjunction with the velocity operator and must be a number value. For example, if you have the velocity condition of “>=” and “5”, then the alert requires that the event be increasing at a rate of greater than or equal to 5 per minute from the last time this event occurred.
(H) Analysis Window: The time window in minutes to analyze if an alert will occur. Generally when an event occurs, it is logged in Observer and then if the same event occurs again in the time window specified here, then an alert will be created. This value must be a number value. For example, if the analysis window is “12”, then an event must occur twice in a 12 minute time window for an alert to occur.
![]() NOTE: After you have created your custom alert, you can modify any field for that custom alert by clicking and typing directly into that field. You can test your custom alert by clicking the right arrow icon (
NOTE: After you have created your custom alert, you can modify any field for that custom alert by clicking and typing directly into that field. You can test your custom alert by clicking the right arrow icon (![]() ) or delete your custom alert by clicking the trash icon (
) or delete your custom alert by clicking the trash icon (![]() ). Testing your custom alert will not actually create an alert.
). Testing your custom alert will not actually create an alert.
![]() This is an advanced procedure that requires knowledge of scripting with ServiceNow APIs.
This is an advanced procedure that requires knowledge of scripting with ServiceNow APIs.
To create an event for slow transactions:
- In ServiceNow, type Scheduled Jobs into the Filter Navigator in the top left and select it (it should appear under Perspectium > Observer)
- At the top of the Scheduled Jobs form, click New to create a new Scheduled Job
- Type a name for your new Scheduled Job and make sure the Active box is checked
Scroll to the scripting section and type your script for the new job
Below is an example of a script that could be used to create a new Scheduled Job for Observer called slow.transaction. For more information about creating scripts for Perspectium Jobs in ServiceNow, see the ServiceNow API Reference Guide.// Identify any instance within the last 15 minutes of the job "JOB: Perspectium MultiOutput Processing" running longer than 1000; output one event per instance found var gr = new GlideRecord("syslog_transaction"); gr.addEncodedQuery("type=scheduler^url=JOB: Perspectium MultiOutput Processing^sys_created_onONLast 15 minutes@javascript:gs.minutesAgoStart(15)@javascript:gs.minutesAgoEnd(0)"); gr.addQuery("response_time", ">", 1000); gr.query(); while(gr.next()){ var msg = "Job " + gr.url + "(" + gr.sys_id + ") is taking too long: " + gr.response_time + " ms"; gs.eventQueue('slow.transaction', current, msg); }- Click Submit
- To apply the script, go to the Event Subscription module by searching in ServiceNow's filter search at the left (it should appear under Perspectium > Observer)
- Click New to create a new Event Subscription
- Type a name for your new Event Subscription next to Event
For the script section, add your script according to the example below
answer = event.param1 + "|" + event.param2
- Click Submit
![]() This is an advanced procedure that requires knowledge of scripting with ServiceNow APIs.
This is an advanced procedure that requires knowledge of scripting with ServiceNow APIs.
In ServiceNow, you can create your own Perspectium Action to perform custom monitoring and send in your own events. For example, you may want to monitor the total number of tasks created daily. You can do this by leveraging the PerspectiumObserver script include that comes as part of the Perspectium Core Update Set for ServiceNow. The following functions available for use in the PerspectiumObserver script include:
Function | Arguments |
|---|---|
postTuple |
|
| postDailyTableAggregates |
|
| postTableAggregates |
|
| postSecondsAgoTableAggregates |
|
Custom flags can be posted to Observer to mark an integration event such as success or failure. These flags can be used to alert as well.
Here's how to create a method that will post your custom flag to Observer using Python and the AMQP Python client:
Create a method that will post the flag to Observer using the code below, where <perspectium_mesh_url> is the Perspectium Mesh URL and <customer_vhost> is your vhost as provided by Perspectium.
#!/usr/bin/env python

import pika
import sys
import socket
import os
import time

def postFlag():
	credentials = pika.PlainCredentials('username','password')
	connection = pika.BlockingConnection(pika.ConnectionParameters('<perspectium_mesh_url>',5672,'<customer_vhost>',credentials))
	channel = connection.channel()
	channel.queue_declare(queue="")
	channel.basic_publish(exchange='',routing_key='psp.in.servicenow',body='{ topic:"monitor", type:"label", key:"perspectiumdemo1", name:"integration.failed", value: "1"}')
	connection.close()
Call the postFlag() method in a try/catch block
try:
    soapMethodToServiceNow();
except Exception e:
    print "Integration failed, posting integration flag to Observer"
    postFlag()
Now, log into Observer and click the Settings icon (
 )
)Click Alert Configurations
Click the Events tab
Enter a name for your custom alert under the Name heading and select a Type from the dropdown
Click Save
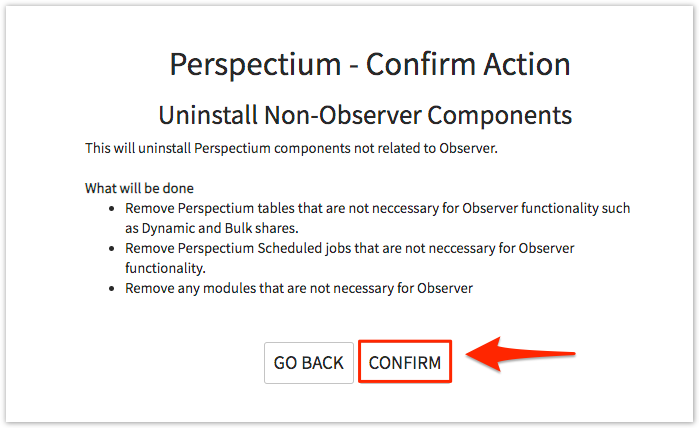
After installing the Perspectium for ServiceNow update set and the Perspectium Observer update set, you have the option to uninstall non-Observer tables, scheduled jobs, and modules from your ServiceNow instance. The Uninstall Non-Observer Components module ensures easy and secure removal of Perspectium features (e.g. group share, bulk share, etc.) that are not needed by Observer.
To access this module, go to Perspectium > Observer > Uninstall Non-Observer Components. Click Confirm to proceed with uninstalling all non-related Observer features from Perspectium.
You may have to log out and log back in to your ServiceNow instance in order to see all non-Observer modules removed from the navigation menu on the left.
Tables that get removed may vary depending what version of the update set you have installed. Check the table below for ServiceNow tables and scheduled jobs that will NOT be removed:
| Tables | Scheduled Jobs | |
|---|---|---|
| psp_event_subscription | Perspectium Check Outbound Message Limit | |
| psp_follow_transaction | Perspectium Data Cleaner - but need to modify | |
| psp_in_message | Perspectium Dynamic Sync Up | |
| psp_out_message | Perspectium Install | |
| u_psp_actions | Perspectium MultiOutput Processing | |
| u_psp_alerts | Perspectium Follow Transactions | |
| u_psp_data_cleaner | Perspectium Observer Actions | |
| u_psp_imp_alert | Perspectium Observer Actions Daily | |
| u_psp_log_message | Perspectium Observer Actions Hourly | |
| u_psp_observer_out_message | Perspectium Observer Data Cleaner | |
| u_psp_properties | Perspectium Observer Install | |
| u_psp_queue_history | Perspectium Observer Outbound Processing | |
| u_psp_queues | Perspectium Outbound Counter Processor | |
| u_psp_sit_template - used with alerts | Perspectium Queue History Data Cleaner | |
| u_psp_situations - used with alerts | Perspectium Queue Monitor | |
| u_psp_uninstall | Perspectium Replicator Subscriber | |
| u_psp_heartbeat | Perspectium Error Notification |
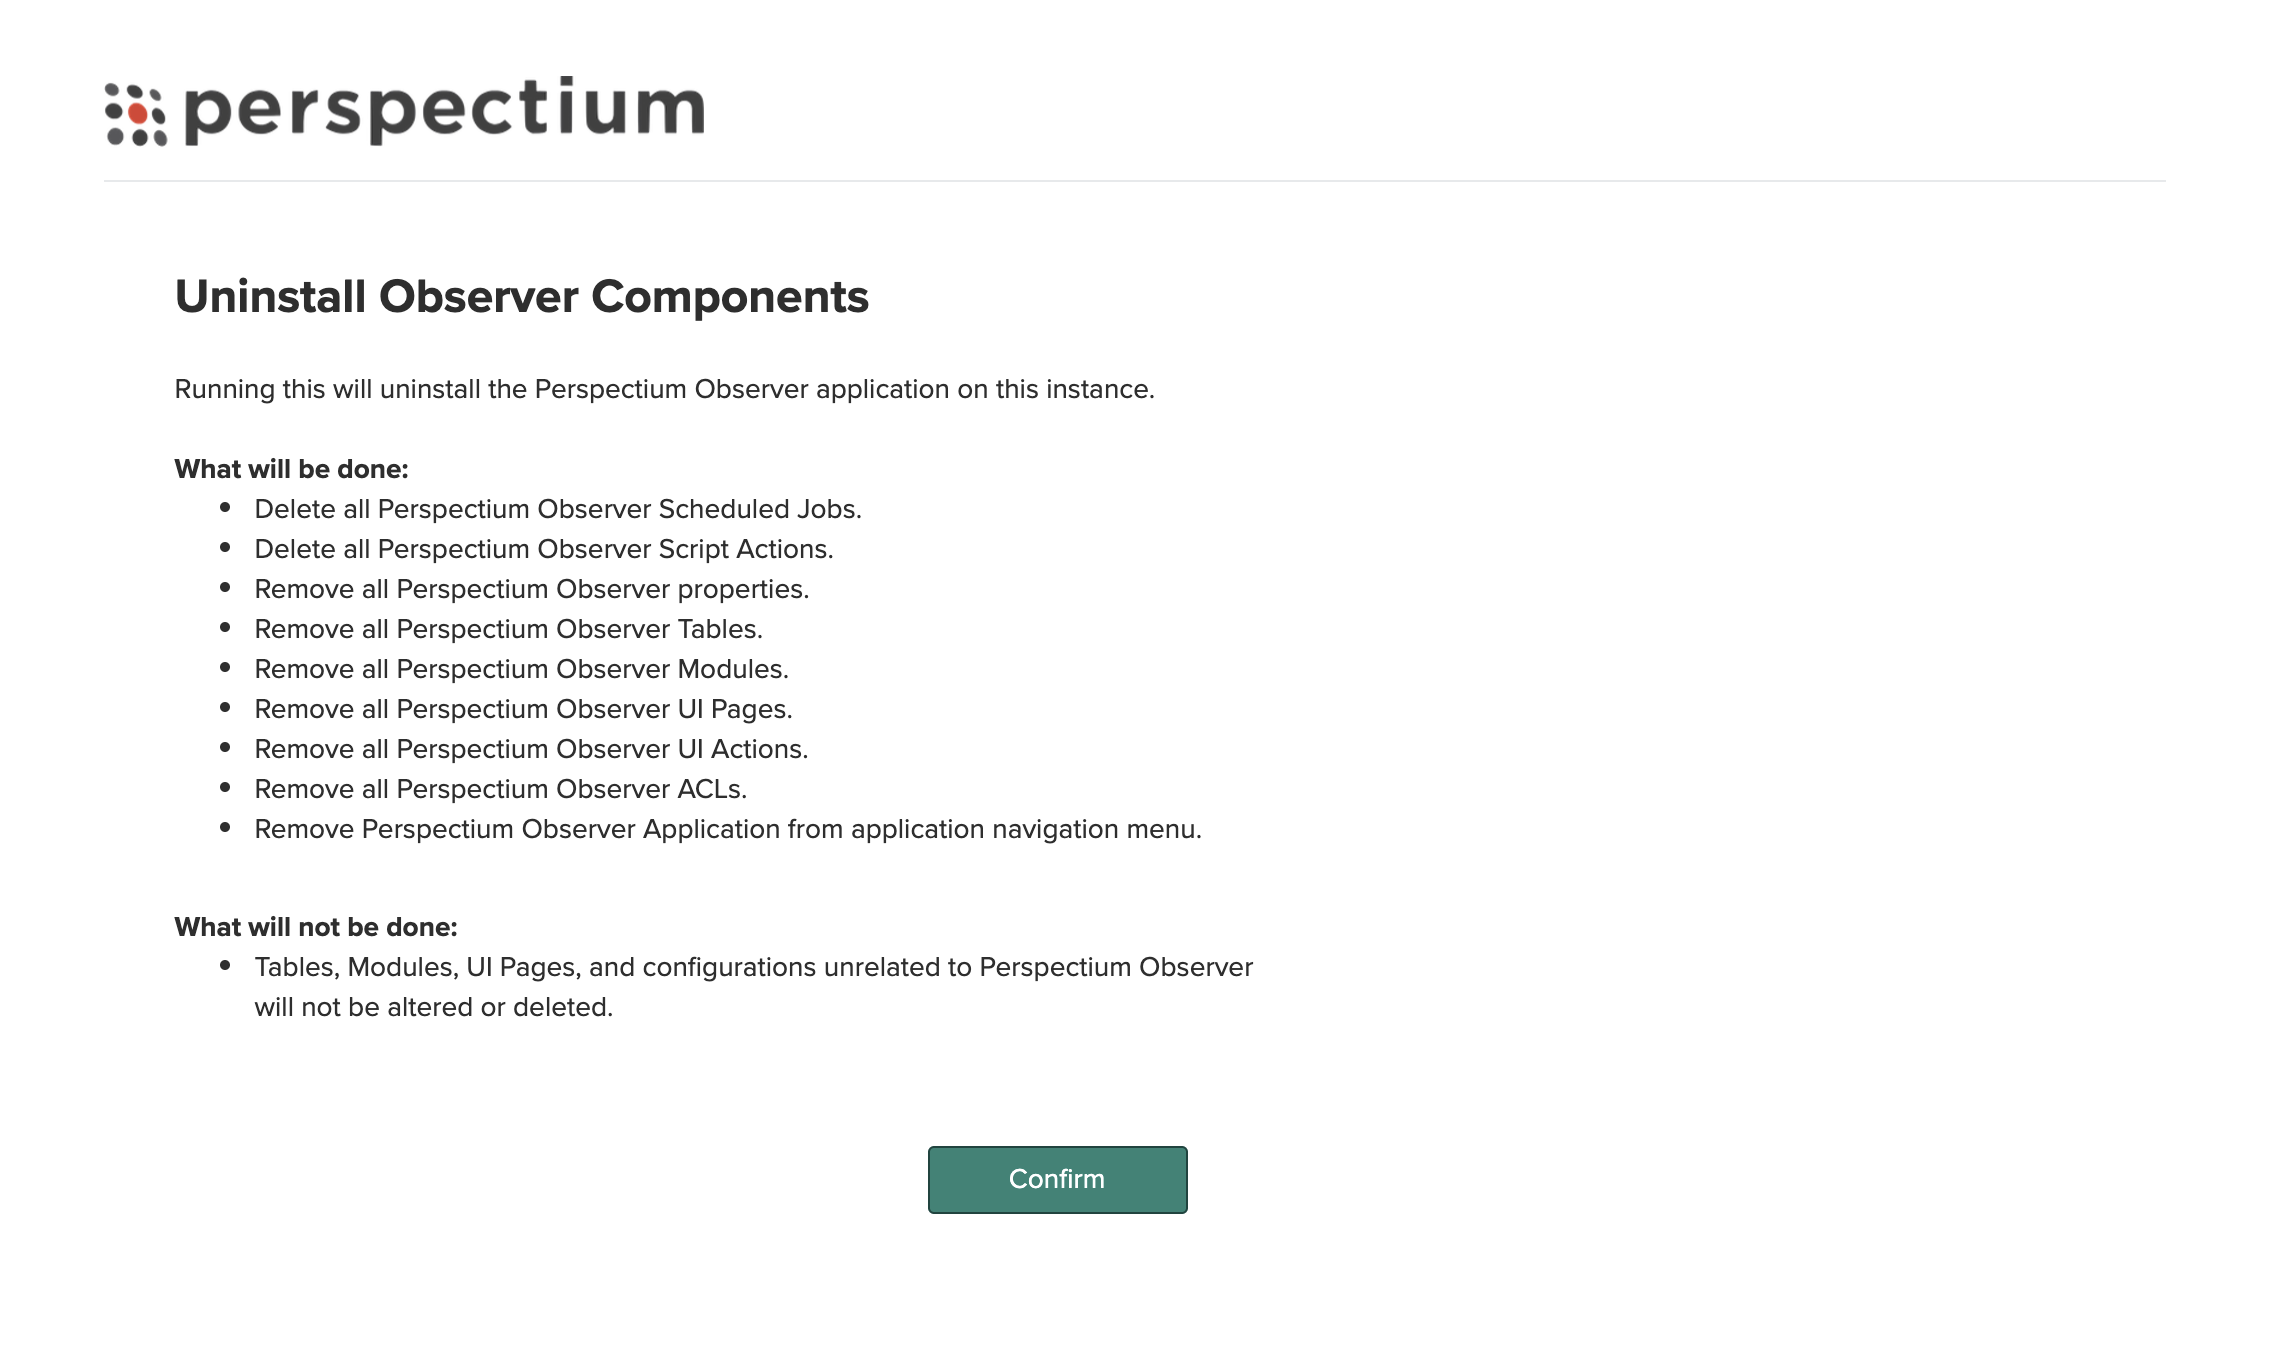
The Uninstall Observer module ensures easy and secure removal of Perspectium Observer features.
To access this module, go to Perspectium > Observer > --Uninstall Observer. Click Confirm to proceed with uninstalling all Observer-related features from Perspectium.
![]() NOTE: You may have to log out and log back in to your ServiceNow instance in order to see all Observer modules removed from the navigation menu on the left.
NOTE: You may have to log out and log back in to your ServiceNow instance in order to see all Observer modules removed from the navigation menu on the left.
Disabling the Observer upset set will stop Perspectium Observer jobs from running on your ServiceNow instance.
Here's how:
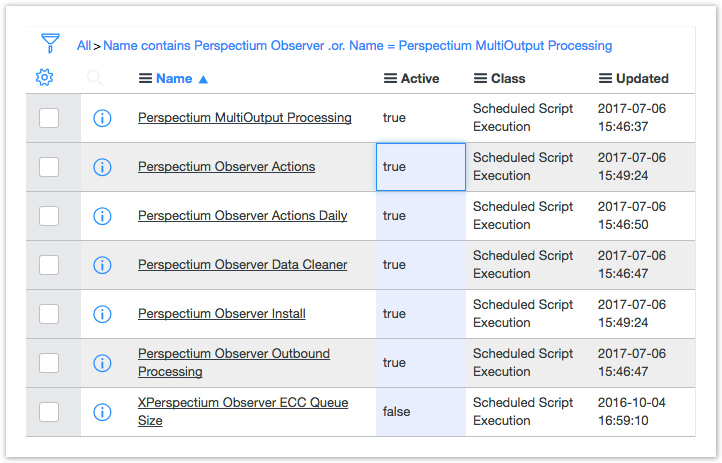
Go to Perspectium > Observer > Scheduled Jobs and set the Active field on all jobs to false - this will stop any Perspectium jobs currently runing, and set the triggers to cancel them from running again
Warning
DO NOT deactivate Perspectium MultiOutput Processing.
Now, delete all of the scheduled jobs that were set to false in step 1 - this prevents someone from accidentally scheduling the jobs to run again.
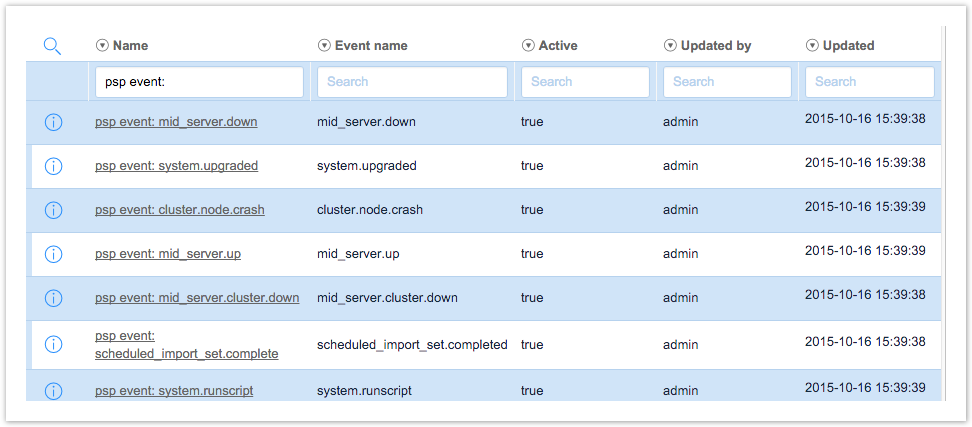
- In addition to the Scheduled Jobs, which poll for data, there are Event Listeners, made up of the Event Subscription and associated built-in Script Actions. Now, delete all Event Listeners, which will also delete all associated Script Actions.
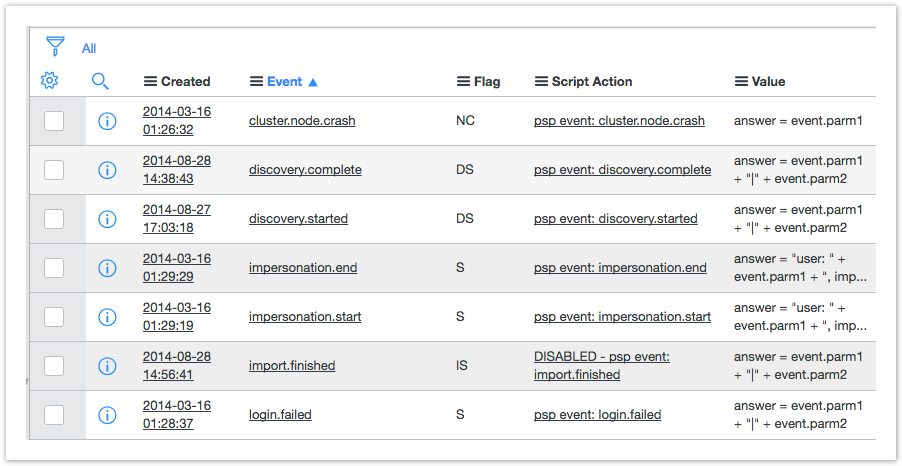
- Step 3 should account for all out-of-box Perspectium Script Actions, but you should double check that all Script Actions are deleted, included any custom ones that may have been created. To do so, go to Perspectium > Observer > Script Actions and delete any remaining script actions listed.
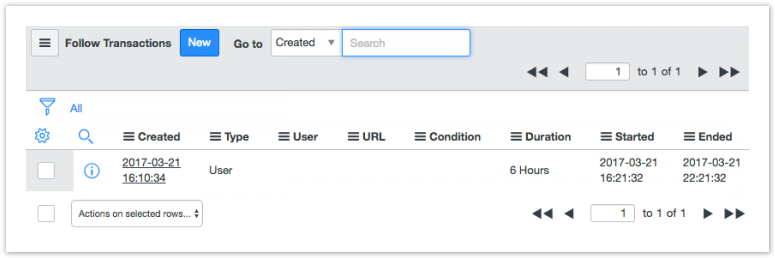
- Next, delete all Follow Transactions - these need to be triggered manually to begin processing, but it's best practice to delete them all
- (Optional) You can hide the Perspectium application from view altogether to prevent users from accessing it - you can remove it by following the steps on Application navigator
- (Optional) You can remove the tables for Observer, since it won't be generating or posting any messages. If you wish, delete the following tables only (we recommend leaving any remaining tables intact):
u_psp_situations
u_psp_sit_template
psp_event_subscription
psp_follow_transaction
u_psp_actions
u_psp_observer_out_message
In Observer's trend chart, you have the option to assign URLs to flags, allowing you to simply click on a flag to open a webpage.
Here's how:
- Click on any flag that appears on a trend chart
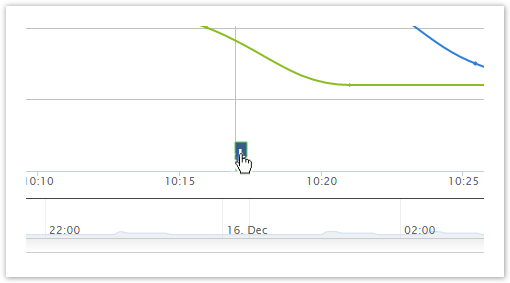
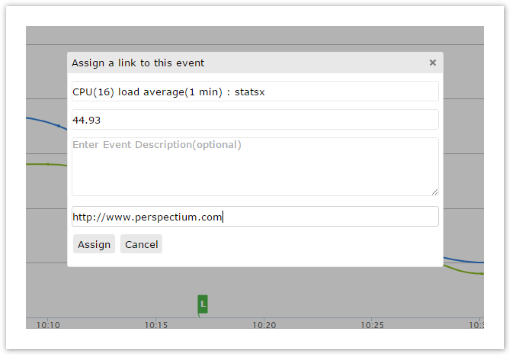
- If a URL has not yet been assigned, a dialogue box should pop up, which displays the name and value of the flag, along with fields to add a URL and description (optional). Fill out the URL field, and the description field (if you wish), and click Assign
- If you want to modify the URL once it's been assigned to the flag, you can do so in Settings > Alert Configurations > Events
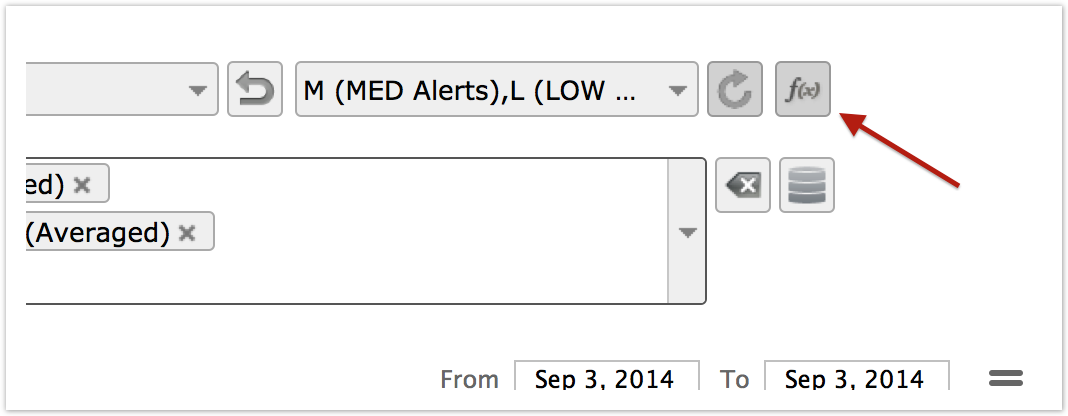
For any trend chart, you can generate an aggregate table of all metrics according to a specific date/time range, just with the click of one button. The generated table will contain AVG, MIN, MAX, STD-DEV, and the total COUNT of the values in the range.
To aggregate a chart, click the function icon (![]() ) as seen below
) as seen below
This is an example of alerting when an import set run does not complete. If you are familiar with firing a custom event within ServiceNow, you can skip to step 3.
To illustrate the process of creating a custom event, we will use the example of an event firing for import set runs. To do this, go to the Registration module and create a new event. The name you choose should be unique and clearly reflect the event in question. As seen in the image below, the example shown has the Event name sys_import_set_run.failed on the table sys_import_set_run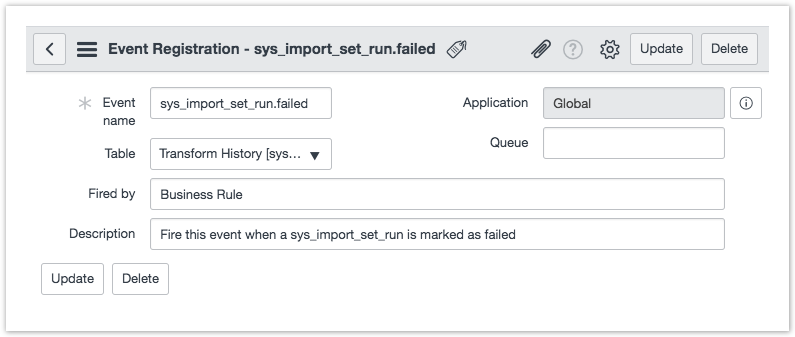
Next, you need to fire the event. There are several different ways you can do this in ServiceNow, such as via Scheduled Jobs, UI Actions, Scripting, Business Rules, and more. For this example, we'll use a Business Rule to fire the event when the import set run state changes to Did not complete. 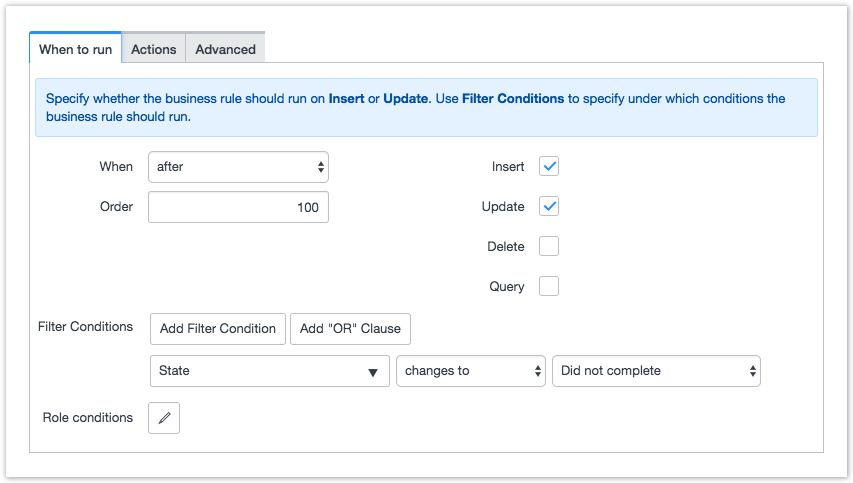
Then, fire the event using the gs.eventQueue command, with the following parameters: Event Name, Current Record, String Parameter 1, String Parameter 2. Choose the parameters that make sense in the context of the event in question. These values can be anything for the sake of Observer. See the image below for an example, which includes the table name and import set number.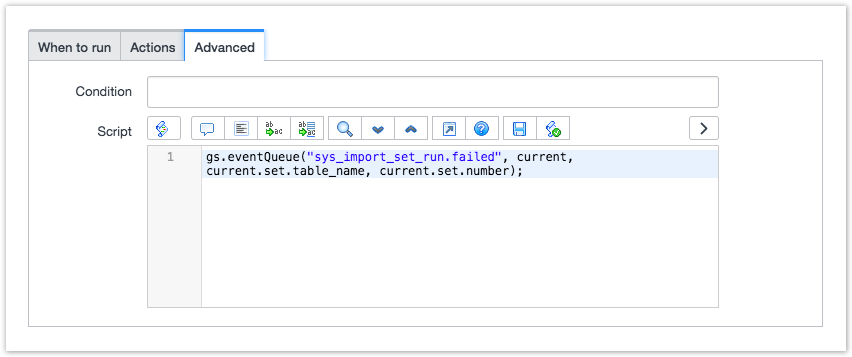
Now that the event is created and fired, you can set up Observer to monitor these events.
Create an Event Subscription from within Observer's Event Subscription module - once there, click New.
In the Event field, find and select the created event you want to reference. Then, choose a custom flag - this will make more sense once you reach step 5.
For the example in the image below, we used the flag ISF for Import Set Failed.
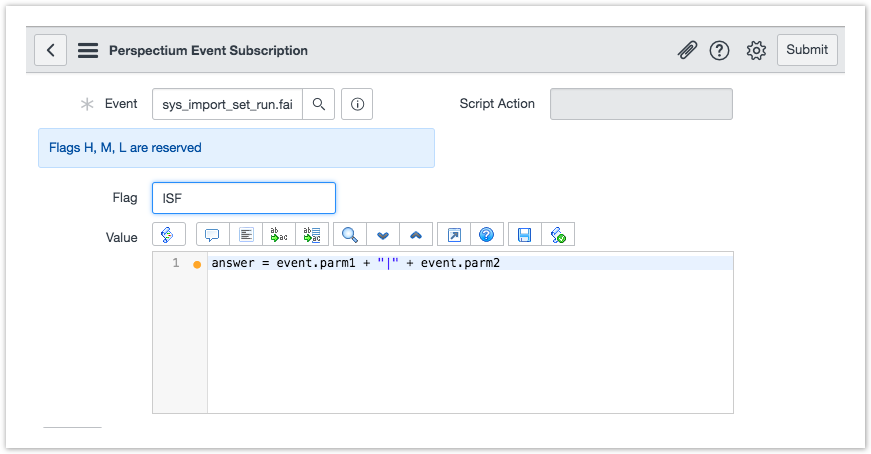
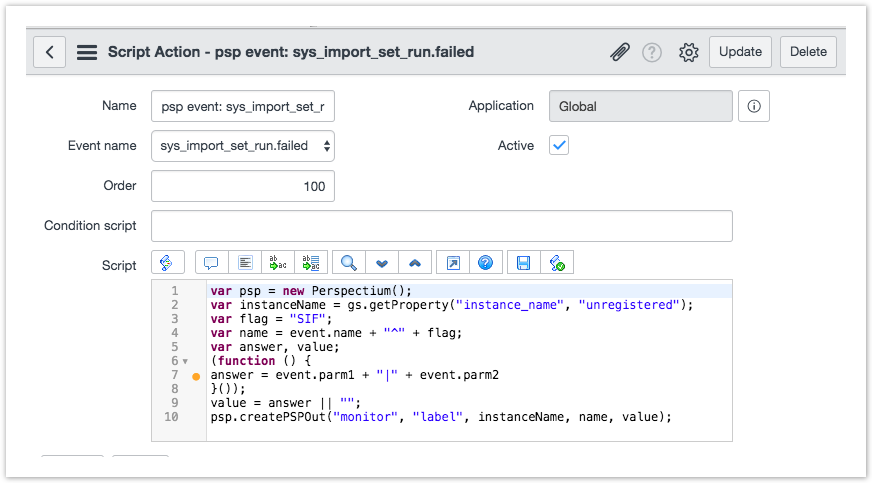
Click Submit, and the Script Action will be auto-generated to send out the message. You should not need to modify this.
As long as your credentials are set up correctly, the message will be sent when the event is fired. Next, you may want to configure Alerts to go along with the Event. Here's how:
Verify emails
In Settings > Notifications > Emails, verify the emails and associated alert priority that you want for this event.
Configure the Alert
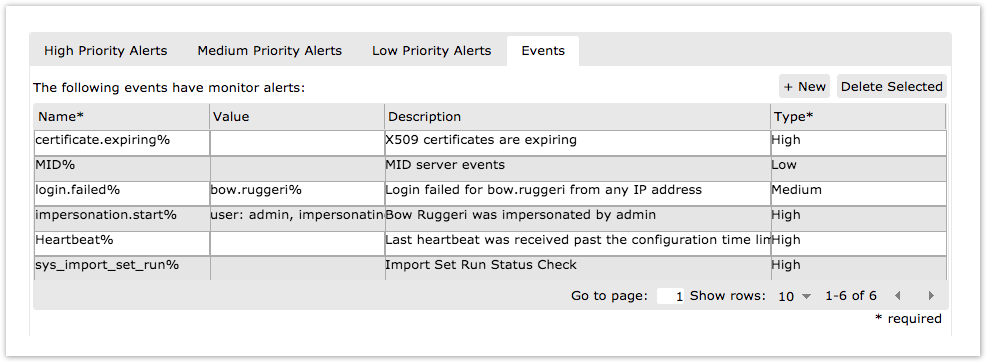
In Settings > Alert Configurations > Events, create the appropriate event handler.
Column | Description |
|---|---|
| Name | The name of the event to trigger an alert. Use “%” at the end of the name to treat the end as a wildcard e.g. “sys_import_set_run%”. This way events such as “sys_import_set_run.success” and “sys_import_set_run.failed” will both trigger an alert. |
| Value | The minimum value to trigger an alert. Leave this blank if any value for this event should trigger an alert. |
| Description | A plain text description for the alert, for your own use. |
| Type | The type of alert to trigger. Options available are High, Medium, and Low. |
Events as received by Observer will not have the ^FLAG value at the end, so you should not specify the event name as Name^FLAG, as this will cause the event alert to not find a match, and as a result, will not fire an alert.
This event configuration will map the ServiceNow flag from its original (in the example we used earlier, the flag would be ISF), to a flag based on the priority assigned (in this example, it was H (High)).
Note for Dubnium users
In the Dubnium version, custom events can be tested like custom alerts after they are saved. This can be done by clicking on the Play icon (>) under Actions. The garbage icon replaces the "Date Selected" button. After being tested, the event will be shown in the monitor and in the list after refreshing the page. Since these custom events have types High, Medium, and Low, they will only show in the Alert lists, not in the Event list, when tested.
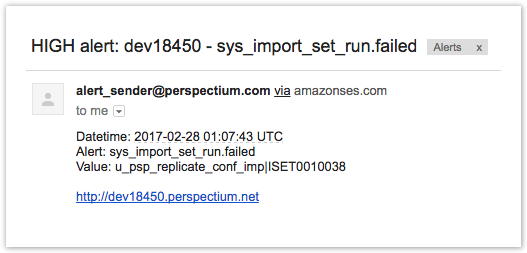
Example Email
Here is the email that you would receive for the example we gave:
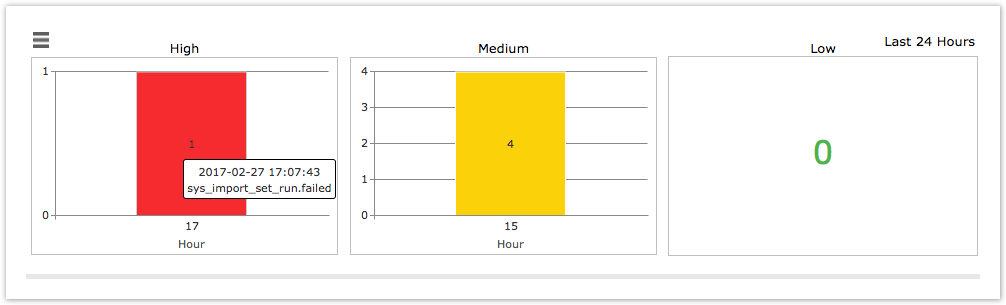
If you assigned the Event to a High, Medium, or Low priority, it will appear on your Monitor page.
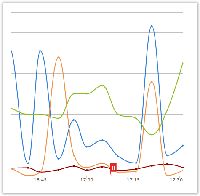
It will also appear on your Overview page under your trend group charts, so you can view metrics relative to the moment the event occurred. Notice in the chart below, the example that we used is showing up as a flag labelled "H" for High priority.
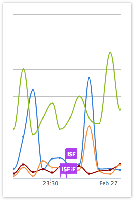
If you do not create a specific Event configuration within Observer, it will still appear within the trend group chart, but with the flag that you assigned it within ServiceNow. Below, you can see our example with the ISF flag.
When might you want to use this?
This feature can be very helpful if, let's say, you upgrade a subsystem and want to compare the SQL response metrics before and after.