After setting up your bulk or dynamic share within your SeviceNow sharing instance, ServiceNow data will be collected into Splunk's HTTP Event Collector. Event Collections can be filtered by source type if multiple data sources were configured when generating your Splunk Event Collector token.
Prerequisites
You will first need to create a ServiceNow bulk/dynamic share for Splunk.
You will also need to point your Splunk HTTP Event Collector port to the Perspectium Integration Mesh and generate a Splunk Event Collector token.
Procedure
To view your event collections in Splunk, follow these steps:
After executing your bulk share for Splunk or creating your dynamic share for Splunk and creating/updating/deleting records, log into your Splunk instance and click the Splunk logo to navigate to your instance's homepage.
From the left side navigation menu, click Search and Reporting.
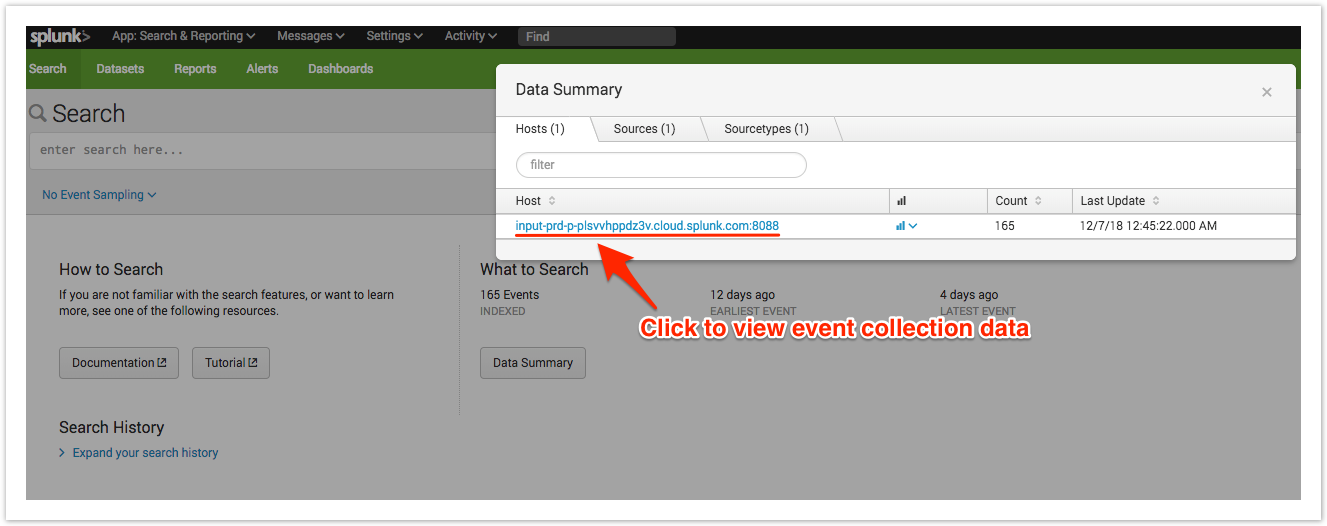
On the resulting page, click the Data Summary button under What to Search. Then, click your Spunk instance name under Host.
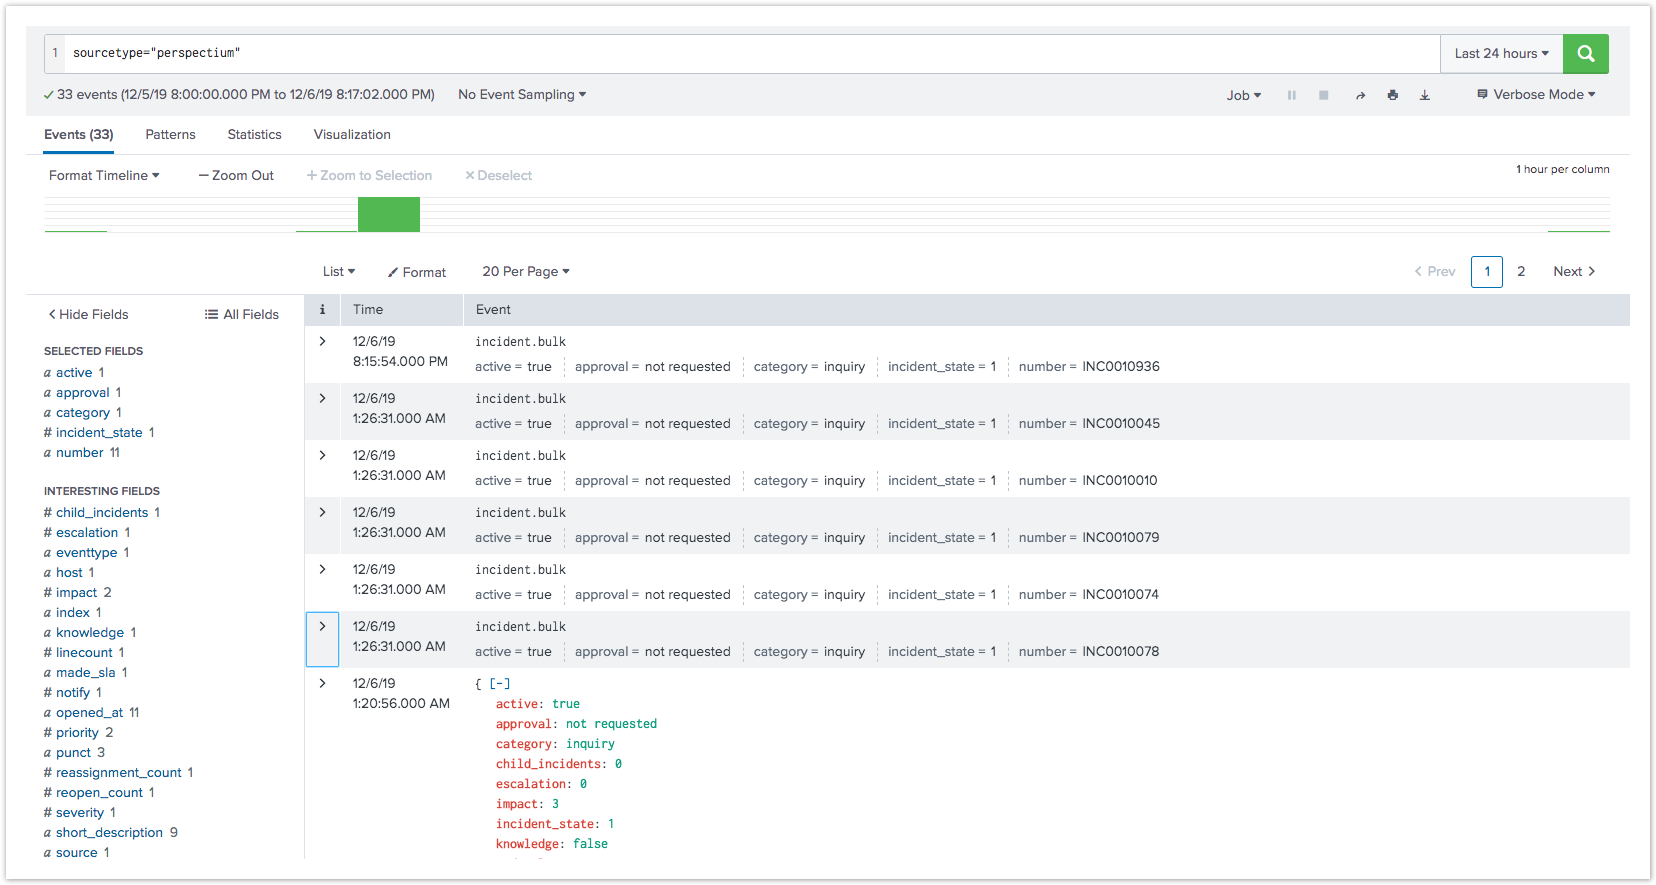
Your event collection data will appear on the resulting page.
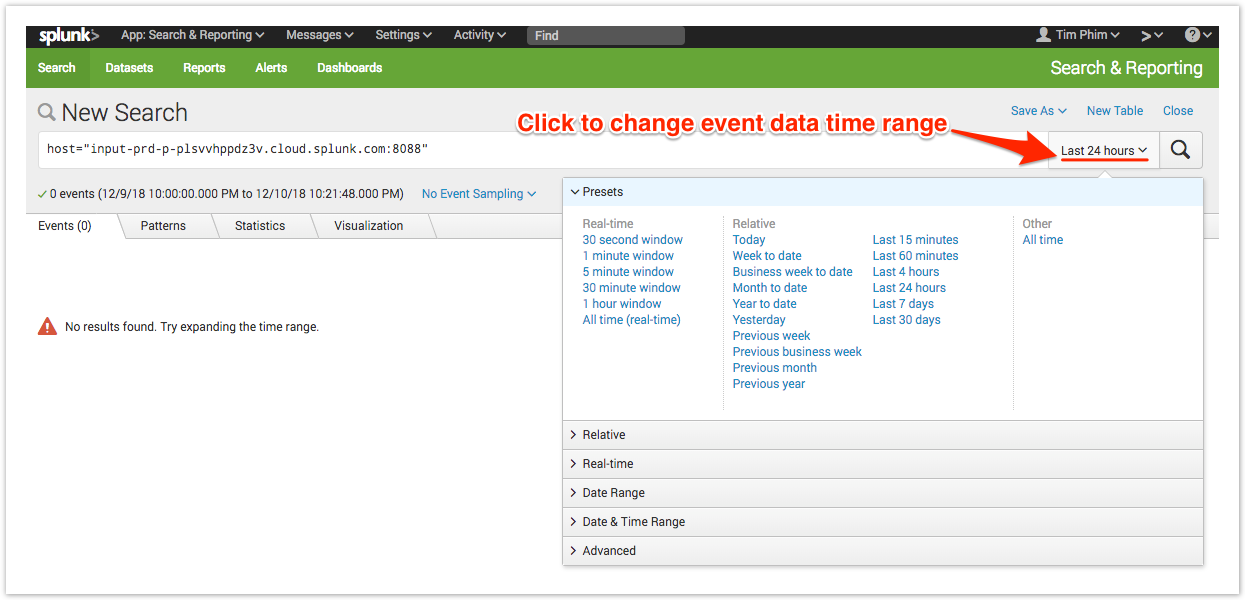
If no data appears or if you want to view data for a specific time/date range, click the Last 24 hours dropdown at the top right-hand corner of the form to change the time range for which your event collection data will be displayed.
By default, data is saved into Splunk where the event name is the name field of the outbound message such as incident.bulk and the fields of the shared record are saved as fields in the Splunk event:
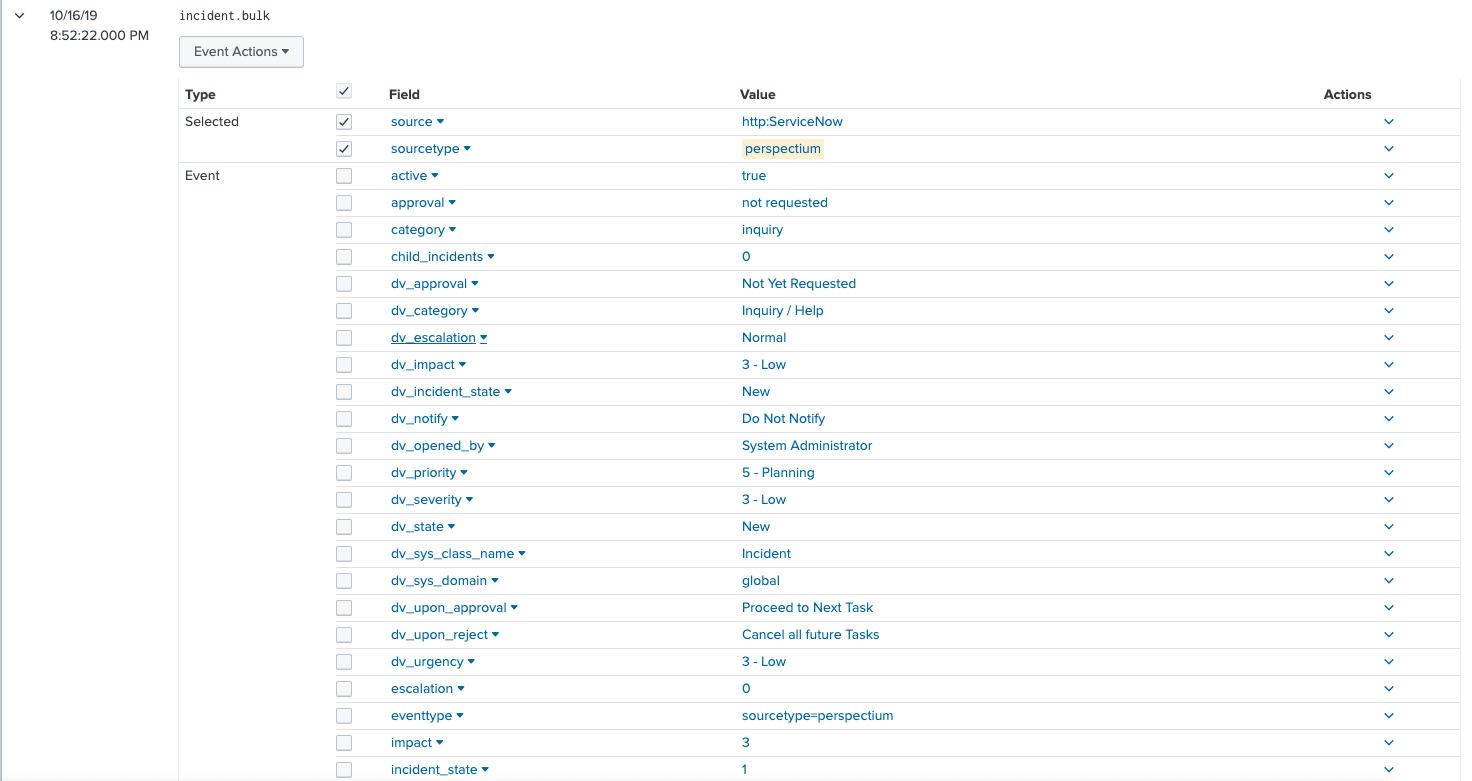
But data can also be saved such that all the record's fields are saved in the Event name instead:
To save data in this format, update the Splunk meshlet's configuration file to have the saveInEvent configuration as true:
perspectium:
        message:
            saveInEvent: true
Contact support@perspectium.com if you have any questions on updating this and other configurations.
No valid Data Center license found
Please go to Atlassian Marketplace to purchase or evaluate Refined Toolkit for Confluence Data Center.Please read this document to get more information about the newly released Data Center version.


