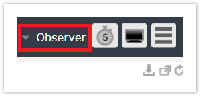
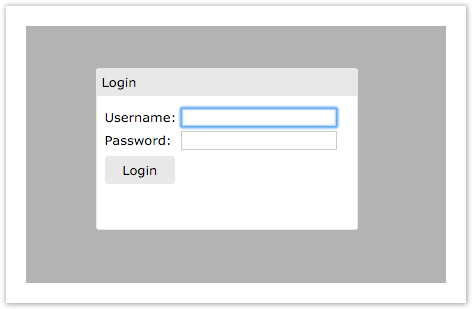
Versions Compared

Key

  • This line was added.
  • This line was removed.
  • Formatting was changed.


User Authentication


UI Expand
titleUser Authentication


Divbox
stylebackground: white

When you visit the Dashboard for your family of instances and agents, you will be presented with the login screen:

You will receive your user credentials upon set up. For additional users please contact support.

Once logged in, the current user is displayed at the bottom of the page. You can logout from the account by clicking the Logout next to the username.


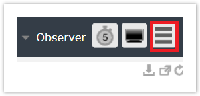
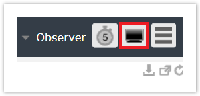
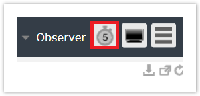
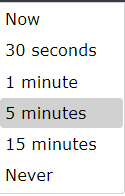
Dashboard Configuration

There are a variety of options available for you to customize the dashboard to your liking:

UI Expand
titleAccessing the menu


Divbox
stylebackground: white

The menu option on the far right allows you to navigate to the different dashboard pages. To change to a different page, click on the menu button to open up the list of pages:

Then select from the following options: 


UI Expand
titleMenu options


Divbox
stylebackground: white

The following are the available options under the Menu:


UI Expand
titleReplicator Share


Divbox
stylebackground: white

With Replicator Share, you can monitor records, record types and bytes of data shared out from DataSync Agent.

In Record Types, errors are split by type (i.e. ticket.error, incident.error) as shown below.


UI Expand
titleReplicator Subscribe


Divbox
stylebackground: white

With Replicator Subscribe, you can monitor records, record types and bytes of data subscribed to.

In Record Types, errors are split by type (i.e. ticket.error, incident.error) as shown below.


UI Expand
titleReport


Divbox
stylebackground: white

The Replicator section on the Report page provides you a Download option that allows you to download a CSV file that contains a daily breakdown of how many records your instances and agents are sharing and subscribing.

An example of the content in the CSV files is as follows:

instance,type,date,name,count
dev291,share,1_4_2017,incident.bulk,60000
dev291,share,1_19_2017,incident.bulk,5
dev291,share,1_20_2017,incident.bulk,2
dev291,share,1_24_2017,incident.bulk,1
dev291,share,1_24_2017,task.bulk,1
dev291,share,1_30_2017,incident.bulk,259208
dev068,share,1_21_2017,ticket.bulk,6

Click on Select Date Range to specify a range of dates to download records. Click on Download All to download all record counts.


UI Expand
titleLayout


Divbox
stylebackground: white

There are three different window layouts to choose from. Shown below are examples of the different types of layouts.

2x2 Grid 

1x1 Grid 


UI Expand
titleSettings


Divbox
stylebackground: white

This option will take you to the settings page where you can adjust the following settings:

  • Change Password
  • Change UI Color Theme 
    • The option to change the Dashboard's user interface color theme. Current options available are System and Dark.


UI Expand
titleFull screen mode


Divbox
stylebackground: white

Full screen mode is an offered feature through dashboard. In order to enable this feature, select the icon with the monitor at the top right:


UI Expand
titleAutomatic refresh


Divbox
stylebackground: white

Automatic refresh refreshes the dashboard's windows in a selected interval. To change the refresh interval, first start by clicking the timer icon at the top right:

Then select the desired interval:


UI Expand
titleAccessing Observer


Divbox
stylebackground: white

You can access Observer and choose from a list of Observer instances from Dashboard. Start by click on Observer at the top right and select the desired instances.