Page History
| Anchor | ||||
|---|---|---|---|---|
|
This new module is designed to help you understand data exchanges in your instance powered by Perspectium
. On this page, you'll find everything you need to know about installing the dashboard and what features are included.
| Panel | ||||||
|---|---|---|---|---|---|---|
| ||||||
|
| Info |
|---|
The |
dashboard is available only with the Perspectium Core Helium update set, so make sure you have that installed first. To request the latest update set, contact |
Installation
| style | background: white |
|---|
Follow these instructions to install the dashboard feature. If you have completed any of the below steps, simply skip to the next step.
Install the latest Perspectium Core Helium update set (if you haven't already).
UI Text Box type note Starting with Helium 6.1.0 version of the Core application, running Finish Install after installing a Perspectium update set will no longer be required.
- Go to the Perspectium > Control and Configuration > Finish Install and click Confirm. This will prevent preview errors when the Perspectium Dashboard update set is committed.
- Install the latest Perspectium Dashboard Helium update set.
- Note
- you can also install the Perspectium Dashboard Helium update to an existing instance, but if so, you must run Perspectium Finish Install afterwards.
Accessing the Dashboard
| style | background: white |
|---|
To access your dashboard, go to Perspectium
DashboardCore > Dashboard
In order for the dashboard to display data, you need to first share some data from either bulk or dynamic shares. If your instance does not have any previously-shared data, simply run a few bulk or dynamic shares in order to generate some data to view.
Dashboard Features
Here's a breakdown of all of the features available on your dashboard.
| style | background: white |
|---|
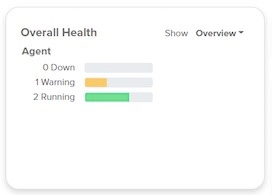
Overall Health
| Info | ||
|---|---|---|
| Divbox | | |
|
In order to active this feature, follow these instructions:
- Download and install any version
- of the DataSync Agent
- Set up the Agent to connect to the same
- Integration Mesh credentials as the Perspectium application on your ServiceNow instance
- Start/use
- the Agent which automatically start sending in heartbeats
Once this is set, the scheduled job will run every 10 minutes and automatically request heartbeats. You can install and run multiple independent agents.
Agent Status Descriptions:
Running:
heartbeatlast heartbeat received is less than or equal to 30 minutes ago
Warning:
heartbeatlast heartbeat received is greater than 30 minutes but less than 60 minutes ago
Down:
heartbeatlast heartbeat received is greater than 60 minutes ago
| title | Queue Status |
|---|
| style | background: white |
|---|
Queue Status
Status Indicators
![]() Active: Queues that are healthy, running with valid credentials, and have the active field set to true are considered active. They are indicated with a green icon.
Active: Queues that are healthy, running with valid credentials, and have the active field set to true are considered active. They are indicated with a green icon.
![]() Not Active: Queues that are disabled or have the active field set to false with no error messages found are considered not active. They are indicated with a grey icon.
Not Active: Queues that are disabled or have the active field set to false with no error messages found are considered not active. They are indicated with a grey icon.
![]() Error: Queues that contain any status errors or indicate unauthorized credentials are flagged as an error. More details about the error can be found from the queue alert field. They are indicated with a red icon.
Error: Queues that contain any status errors or indicate unauthorized credentials are flagged as an error. More details about the error can be found from the queue alert field. They are indicated with a red icon.
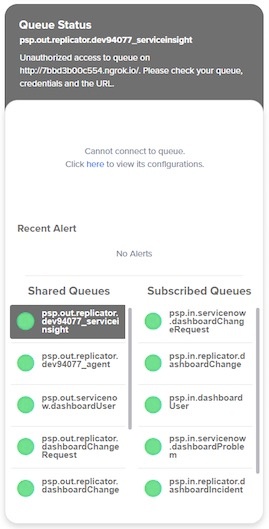
This feature allows you to view all your shared and subscribed queues on your ServiceNow instance in one place. Click on a queue under Shared Queues or Subscribe Queues to view information about it. The queue clicked will have its information, such as queue status, and if available, queue history, displayed on the top part of this widget.
| Info |
|---|
The Queue History table (u_psp_queue_history) stores the queue data shown in the dashboard and is rotated to minimize performance issues on your instance. The default rotation is set up for 8 rotations of 2 days each (16 days total of queue history data). You can adjust the rotation settings to change how much data is saved in this table and subsequently shown on the dashboard. |
Monitor and Track History
On Finish Install of the Dashboard, monitor and track
On first Finish Install, Monitor and Trackhistory will be enabled for all existing queues. This
is controlled by a PSP property in the Properties > Dashboard Properties module.will allow the dashboard to track and queue data.
To disable / enable
the Monitormonitor and
Tracktrack history for all queues:
- Go
- to Perspectium > Control and Configuration > Properties > Dashboard
Uncheck or check the
- Settings
- To enable this feature, turn on the toggle under Enable track history
- for all queues (necessary for Perspectium Dashboard queue display) property
Click
- .
Toggling off this property will disable monitor and track history for all shared and subscribed queues on your instance.
Toggling on this property will enable monitor and track history for all existing shared and subscribed queues. Monitor and track history will also be enabled by default for any new shared and subscribed queues created. - Click Save
![]() NOTE:
NOTE:
Note:
You may be asked to fill in your Perspectium
portal username and passwordSupport Portal credentials in order to save
.To create a new queue when the Enable Track History property is ON:
Go to the Shared/Subscribed Queues moduleClick New
Confirm that Monitor and Track History are enabled on the form
Note: When Enable Track History is off, the new queue record form does not have Monitor and Track History on automatically
To uncheck Monitor and/or Track History on a queue form when Enable Track History is ON:
Go to the Shared/Subscribed Queues moduleClick New or click on an existing queue
Confirm that Monitor and Track History are enabled on the form
Uncheck the Monitor and/or Track History checkboxes
Note: You should see an info message to let you know that it's important to have these checked, since they are necessary to properly display Queue Status on your dashboard.
successfully. Contact Perspectium Support for more information.
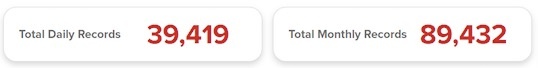
Total Daily/Monthly Records
Total Daily Records: Displays the total record shares for the current day.
Total Monthly Records: Displays the total record shares for the current month.
| Info | |
|---|---|
| Note: Changing the date/month on the calendar does not affect this count.
UI Expand | |
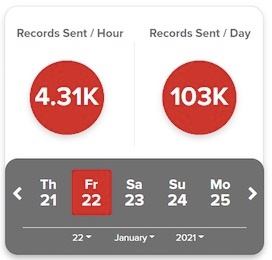
Average Records Sent + Calendar Select
| style | background: white |
|---|
Use this feature to get a breakdown of the number of records sent based on a selected date in the calendar.
Any time you access or reload the dashboard, the calendar date will reset to the current date.
You can change the date on the calendar using the available arrows or the dropdown settings.
The Records Sent/Day count reflects the number of records sent on the specific calendar date selected.
The Records Sent/Hour count is reflects the number of records sent in the the specific calendar date selected, divided by 24 hours. However, if the current date is selected, then this number is divided by the number of hours that have passed in that day so far.
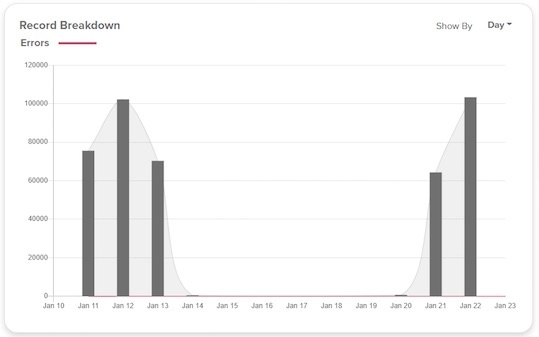
Record Breakdown
The Record Breakdown graph is a visualization of data based on the calendar date selected. It reflects both dynamic and bulk shares. Toggle between different data representation (records per hour, day, month, or lifetime).
| Info |
|---|
Shares from additional related tables selected on a dynamic or bulk share (such as selecting the include attachments or include journal fields options) are not counted in the overall share count displayed on the dashboard. This includes additional shares from tables such as sys_attachment, sys_journal, and sys_audit. |
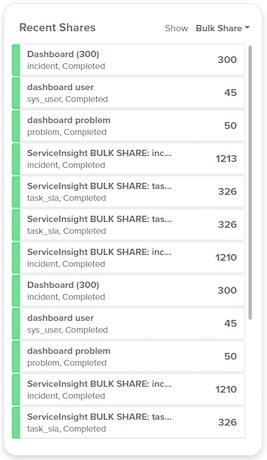
Recent Shares
| style | background: white |
|---|
This feature displays the most recent (up to 50) dynamic/bulk shares from you instance. You can click on any entry to access that specific record directly.
| Info |
|---|
| NOTE: Shares from additional tables are not counted in the overall share count displayed on the dashboard. This inlcudesincludes additional shares from tables such as sys_attachment, sys_journal, and sys_audit. |
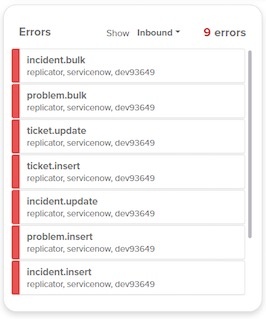
Errors
divbox| style | background: white |
|---|
This feature displays the most recent inbound, outbound, and receipt
errormessages that have an Error state. Click on any entry to access that message directly.
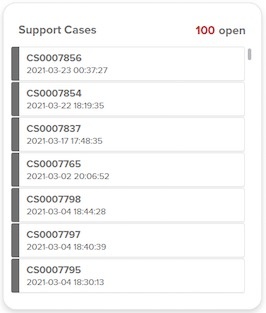
Support Cases
| style | background: white |
|---|
This feature displays your company's most recent display support cases with Perspectium. Access to the Perspectium Portal is required to view support cases directly. If you don't have credentials to your portal, contact Perspectium Support.
In order to access Perspectium Portal support cases:
- Go to Perspectium > Control and Configuration > Properties > Dashboard Settings
- Enter your Perspectium Portal username to access the Perspectium Portal
- Enter the Perspectium Portal password associated with your username
- Click Save
Once this is configured, refresh or revisit your dashboard to view the support cases. You can also access them via Perspectium > Perspectium Core > Dashboard.
| Info |
|---|
Once Perspectium Portal credentials are inputted and saved into the Dashboard Settings, an API request is made to the Perspectium Portal to request an OAuth2 access token to access your support cases. If the Perspectium Portal credentials are valid, the token is saved into the Perspectium properties. This OAuth2 token will be used to view support cases on the dashboard. This API access to the Portal does not require any additional configuration on your ServiceNow instance. |
General Information
| title | General Information |
|---|
| style | background: white |
|---|
The Perspectium Dashboard Data scheduled job creates the instancedaily payload used to retrieve updated queue and recent shares information. This will run periodically every 5 minutes.
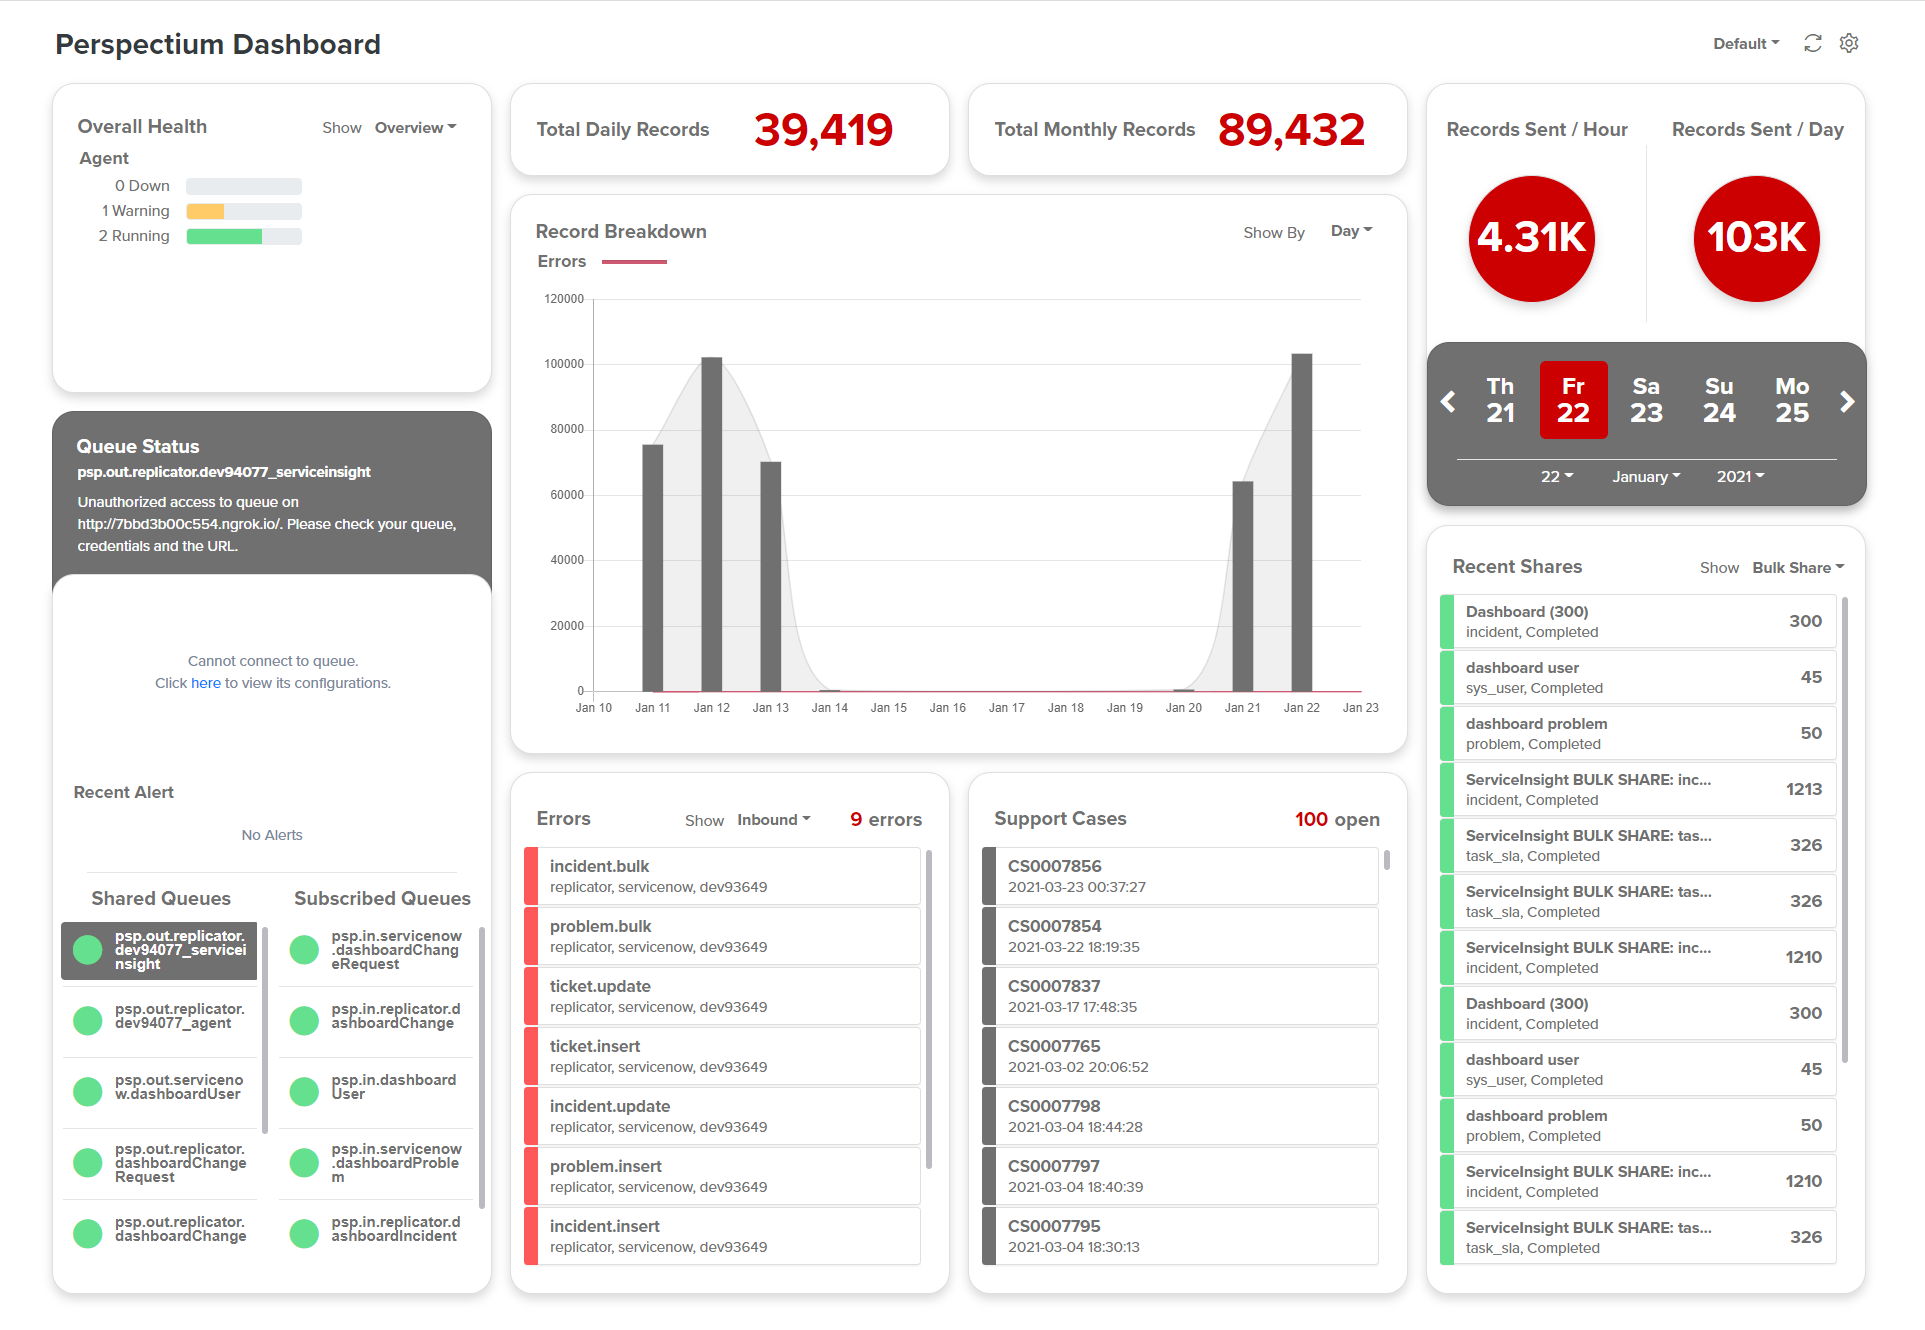
Here's what the Dashboard looks like: